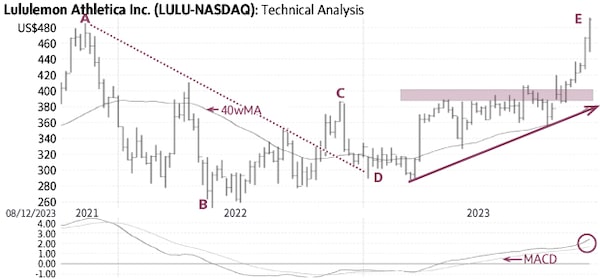
Lululemon (LULU-Q, Wednesday’s close $504.50) declined from US$485.83 in November, 2021 to US$251.51 in May 2022 (A-B) below a falling trendline (dotted line) and the falling 40-week Moving Average (40wMA). In November 2022 the stock rose above both the Average and the trendline to signal the end of the downtrend (C), but returned to the falling trendline near US$290 earlier this year (D). Subsequently, Lululemon rallied again and encountered resistance for about seven months near US$400 (shaded area). The recent rise above this level signaled a breakout and the start of an uptrend toward higher targets (E).
Behaviour indicators including the rising 40wMA and the rising trendline (solid line) confirm the bullish status. Lululemon is becoming overbought in the short-term. A minor correction toward US$425-450 would provide a better entry level. Only a sustained decline below US$400-410 would be negative.
Point & Figure measurements provide a target of US$570. Higher targets are visible.
stock
Monica Rizk is the Senior Technical Analyst of the Phases & Cycles publication (www.capitalightresearch.com). Chart source: www.decisionplus.com
 Monica Rizk