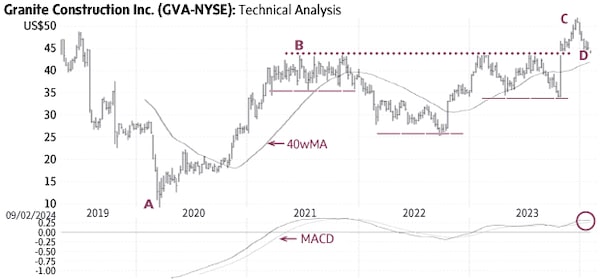
Granite Construction (GVA-N, Thursday’s close US$47.46) declined from US$68.58 in February 2018 (not shown) to US$8.90 in March 2020 (A) followed by a roughly one-half recovery rally (B). The stock then started building a bullish technical base in the form of an Inverse Head-and-Shoulders formation (solid lines). The recent rise above the neckline of this pattern (dotted line) signaled a breakout (C).
Granite Construction was quite overbought at that time due to the sharp rise from US$34 to US$52 and has since experienced a one-third correction (D). Only a sustained decline below US$43-44 (one-half correction) would be negative. A rise above US$47-48 would suggest the resumption of the uptrend.
Point & Figure measurements provide targets of US$54 and US$59. The large Inverse Head-and-Shoulders formation (solid lines) supports higher targets.
stock
Monica Rizk is the Senior Technical Analyst of the Phases & Cycles publication (www.capitalightresearch.com). Chart source: www.decisionplus.com
 Monica Rizk