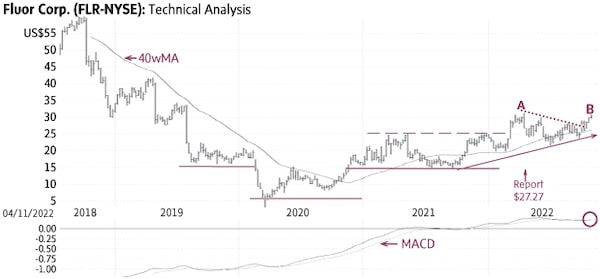
Our previous report (May 13, 2022 - $27.2) identified a bullish Inverse Head-and-Shoulders pattern (solid lines) and a breakout that occurred in March when the stock rose above $25 (dashed line).
Following our publication, Fluor FLR-N (Friday’s close US$31.73) rose to $31.32 (A), had a correction while below a falling trendline (dotted line) but found good support at the rising trendline (solid line). The recent rise above the falling trendline suggests the stock is ready to resume the uptrend (B); a sustained rise above $30 would confirm it.
Behaviour indicators including the rising 40-week Moving Average (40wMA) and the rising trendline confirm the bullish status. There is good support near ±$26; only a sustained decline below this level would be negative.
Point & Figure measurements provide targets of $34 and $36. Potentially higher targets are visible.

stock
Monica Rizk is the Senior Technical Analyst of the Phases & Cycles publication (www.capitalightresearch.com). Chart source: www.decisionplus.com
Be smart with your money. Get the latest investing insights delivered right to your inbox three times a week, with the Globe Investor newsletter. Sign up today.