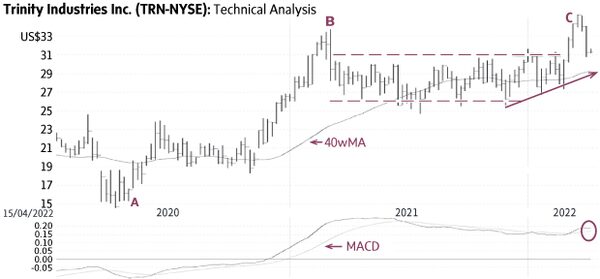
Trinity Industries TRN-N (Thursday’s close US$31.74) rallied from US$14.53 in April, 2020, to US$33.76 in March, 2021 (A-B), and then settled in a horizontal trading range mostly between US$26 and US$31 (dashed lines). The recent rise above this range signalled a breakout and the start of an uptrend toward higher targets (C).
Behaviour indicators including the rising 40-week Moving Average (40wMA) and the rising trend-line (solid line) confirm the bullish status. The current correction provides a good entry level. Only a sustained decline below the 40wMA (currently near US$29) would be negative.
Point & Figure measurements provide a target of US$36. The large trading range (dashed lines) supports higher targets.
stock
Monica Rizk is the senior technical analyst of Phases & Cycles Inc. (phases-cycles.com). Chart source: www.decisionplus.com
Be smart with your money. Get the latest investing insights delivered right to your inbox three times a week, with the Globe Investor newsletter. Sign up today.
 Monica Rizk