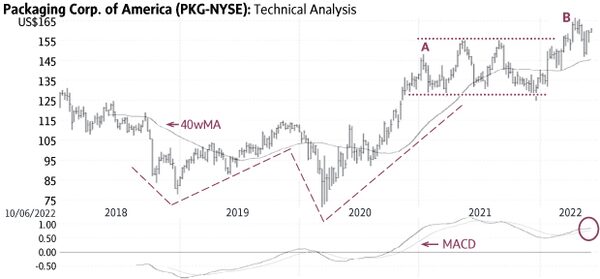
Packaging Corp. (Friday’s close US$151.50) built a large bullish base in the shape of a “W” pattern from 2018 to 2020 (dashed lines). It had a breakout from this formation in 2020, reached a high of US$148.14 in January 2021 (A) and then settled in a wide horizontal trading range mostly between US$130 and US$155 for about a year (dotted lines). The recent rise above this range signalled a breakout and the start of an uptrend toward higher targets (B).
Behaviour indicators including the rising 40-week Moving Average (40wMA) and the rising trendline (solid line) confirm the bullish status. There is good support near US$145-150. Only a sustained decline below the 40wMA (currently near US$145) would be negative.
Point & Figure measurements provide targets of US$180 and US$195. Higher targets are visible.
stock
Monica Rizk is the Senior Technical Analyst of the Phases & Cycles publication (www.capitalightresearch.com). Chart source: www.decisionplus.com
Be smart with your money. Get the latest investing insights delivered right to your inbox three times a week, with the Globe Investor newsletter. Sign up today.
 Monica Rizk