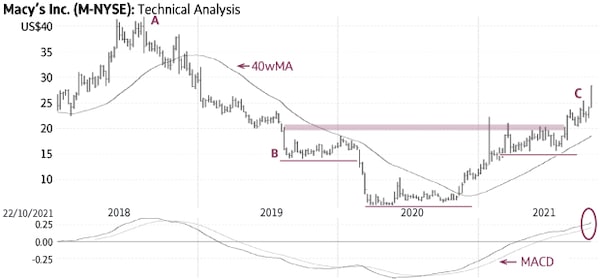
Macy’s (Friday’s close US$26.59) declined from US$41.95 in August, 2018 to US$14.20 in August, 2019 (A-B) and then settled in a bullish technical formation known as an Inverse Head-and-Shoulders (solid lines).
The recent price action above the neckline at US$22-23 (shaded area) signaled a breakout to confirm the start of a new up-trend toward higher targets (C).
Behaviour indicators including the rising 40-week Moving Average (40wMA) confirm the bullish status. There is good support near US$20; only a sustained decline below the 40wMA (currently near US$18) would be negative.
Point & Figure measurements provide an initial target of US$29. The large Inverse Head-and-Shoulders pattern (solid lines) supports higher targets.
stock
Monica Rizk is the senior technical analyst and Ron Meisels is the president of Phases & Cycles Inc. (www.phases-cycles.com). And he tweets at @Ronsbriefs. They may hold shares in companies profiled.
Chart source: decisionplus.com
Be smart with your money. Get the latest investing insights delivered right to your inbox three times a week, with the Globe Investor newsletter. Sign up today.
 Monica Rizk
 Ron Meisels