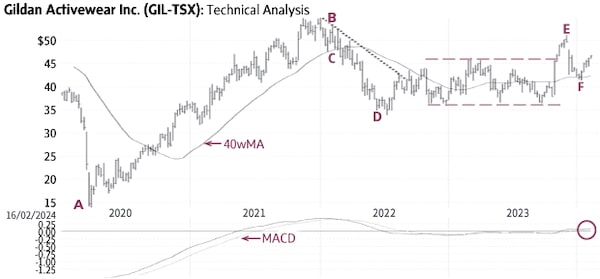
Gildan Activewear (GIL-T, Wednesday’s close $46.52) rallied from $13.64 in March 2020 to $55.13 in January 2022 (A-B), reversed the trend in early-2022 (C) and fell below the 40-week Moving Average (40wMA) while trading below a falling trendline (dotted line), until it reached the one-half correction point at $35 (D). The stock then traded in a horizontal trading range mostly between $36 and $46 (dashed lines). The recent rise above this range signaled a breakout and the start of a new uptrend toward higher targets (E).
Gildan has since pulled back to the 40wMA, where it found good support (F) and now appears ready to resume the uptrend. A decisive rise above $46-47 would confirm it. Only a sustained decline below ±$42 would be negative.
Point & Figure measurements provide targets of $54 and $59. Higher targets are visible.
stock
Monica Rizk is the Senior Technical Analyst of the Phases & Cycles publication (www.capitalightresearch.com). Chart source: www.decisionplus.com
 Monica Rizk