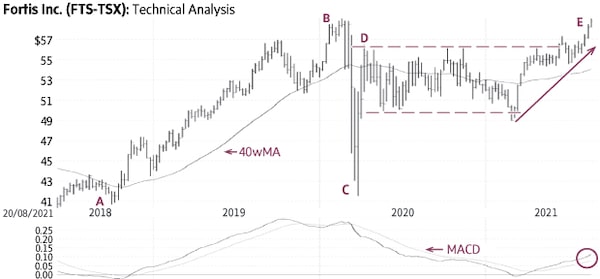
Fortis (Friday’s close $58.60) rallied from $40.71 in October, 2018, to $59.28 in February, 2020 (A-B), had a brief decline in March, 2020 (C), and a quick reversal (D) followed by a horizontal trading range mostly between $50 and $56 (dashed lines). The recent rise above the top of this range signaled a breakout and the start of a new up-trend toward higher targets (E).
Behaviour indicators including the rising 40-week Moving Average (40wMA) and the rising trend-line (solid line) confirm the bullish status. A minor correction toward $57 would provide a good entry point. There is good support near $54.50-55.00; only a sustained decline below this level would be negative.
Point & Figure measurements provide targets of $62 and $69. The large trading range (dashed lines) supports higher targets.
stock
Monica Rizk is the senior technical analyst and Ron Meisels is the president of Phases & Cycles Inc. (www.phases-cycles.com). And he tweets at @Ronsbriefs. They may hold shares in companies profiled.
Chart source: www.decisionplus.com
Be smart with your money. Get the latest investing insights delivered right to your inbox three times a week, with the Globe Investor newsletter. Sign up today.
 Monica Rizk
 Ron Meisels