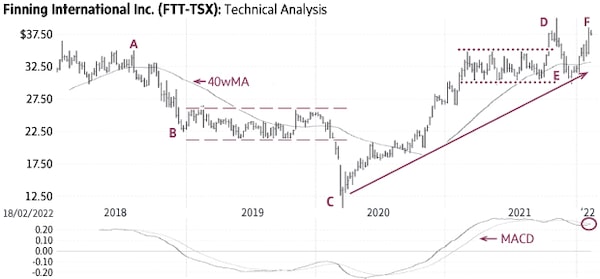
Finning (Friday’s close $37.57) declined from $35.00 in August 2018 to $22.46 in December (A-B), stayed in a horizontal trading range mostly between $21.00 and $26.00 in 2019 (dashed lines) and, after a brief sell-off in March-2020 (C), the stock quickly recovered and started an up-trend above a rising trend-line (solid line).
Finning stayed in a horizontal trading range mostly between $30 and $35 for about seven months (dotted lines). It had a breakout from this range in late-2021 (D), pulled back to support near $31-$32 (E) and now appears ready to resume the up-trend (F).
There is good support near $34-$35; a sustained decline below this level would be negative.
Point & Figure measurement provide a target of $44. Higher targets are visible.
stock
Monica Rizk is the senior Technical Analyst of Phases & Cycles Inc. (www.phases-cycles.com). Chart source: www.decisionplus.com
Be smart with your money. Get the latest investing insights delivered right to your inbox three times a week, with the Globe Investor newsletter. Sign up today.
 Monica Rizk