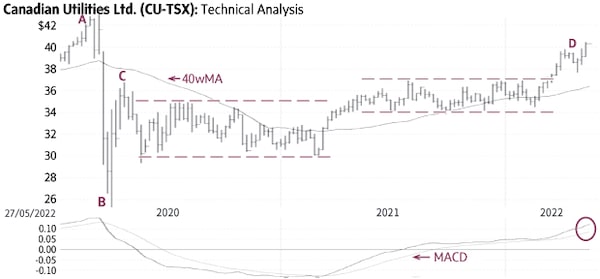
Canadian Utilities CU-T (Friday’s close $39.86) had a sharp decline from $42.97 to $25.25 in March, 2020 (A-B) and a recovery rally to $36.75 in April (C). Subsequently, the stock settled in a horizontal trading range between $30 and $35 and another range between $34 and $37 (dashed lines). This price action produced a bullish base pattern known as a “duplex horizontal.” The recent rise above the top of this formation signalled a breakout and the start of an up-trend toward higher targets (D).
There is good support near $37.50 to $38; only a sustained decline below $36 to $37 would be negative.
Point & Figure measurements provide targets of $44 and $48. The large duplex-horizontal formation (dashed lines) supports higher targets.
stock
Monica Rizk is the senior technical analyst of the Phases & Cycles publication (www.capitalightresearch.com). Chart source: www.decisionplus.com
Be smart with your money. Get the latest investing insights delivered right to your inbox three times a week, with the Globe Investor newsletter. Sign up today.
 Monica Rizk