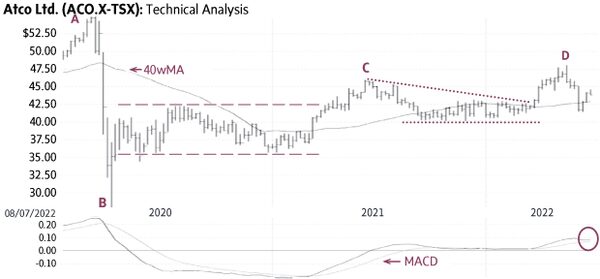
Atco ACO-X-T (Friday’s close $44.09) had a major decline in early-2020 (A-B), followed by a recovery rally and a two-part base formation. The first part consisted of a horizontal trading range mostly between $36 and $43 (dashed lines) and after a minor rise above this range (C) it settled into a very bullish “descending triangle formation” (dotted lines). The recent breakout (D) signalled a change from a base-building pattern to the start of a rising trend. The current correction should provide a good entry level. A rise above $45 would suggest the resumption of the uptrend.
There is good support near $41-42; only a sustained decline below this level would be negative.
Point & Figure measurements provide targets of $52 and $55. Higher targets are also visible.
Editor’s note: In an earlier version of the chart, the "C" notation was incorrectly placed, and the "D" notation was omitted. The chart has been corrected.
stock
Monica Rizk is the Senior Technical Analyst of the Phases & Cycles publication (www.capitalightresearch.com). Chart source: www.decisionplus.com
Be smart with your money. Get the latest investing insights delivered right to your inbox three times a week, with the Globe Investor newsletter. Sign up today.
 Monica Rizk