
SUPPLIED
Our political commentary is intentionally non-partisan. We don’t favor any political party nor any candidate and assess political developments solely for their potential economic and market impact. In our view, doing otherwise introduces potential political bias and invites investing errors.
Fisher Investments Canada knows that politics can affect our emotions, our decisions and even our judgement when it comes to investing. Many investors conflate their perspective on the economy or equity market with their political preferences. But doing so – which is increasingly common in today’s politically polarized world – may be misguided.
As hard as it can be, investors are likely better off keeping their personal politics out of their investment decision-making process. Political biases can introduce potential risks and create investing blind spots. In this article, Fisher Investments Canada will explore the relationship between politics and equities and the potential perils of political bias in investing.
Do equity markets have a preferred political party?
Politics can and often do affect equity markets – just not in the way many perceive. For example, some investors believe the market performs better when one political party holds a majority presence – whether outright or via a coalition – in the government. However, Fisher Investments Canada’s research shows no connection between a certain political party and how equities perform over the long-term. Rather, the relationship between market returns and political leadership regimes is usually spurious at best.
Market returns in the United Kingdom are a good example that illustrates the market’s indifference to political parties. Over the long term, equities have risen regardless of which party is in control. From 1970-2020, UK equities’ average annual return has been 12.1 per cent under Conservative governments and 12.7 per cent under Labour governments – nicely positive for both.1 The small difference appears largely due to economic and market factors beyond any politician’s control. Similar patterns occur in other developed equity markets. The simple fact is that in the long term, markets are typically up more often than they are down – regardless of who is in power.
U.S. politics can have global reach
Fisher Investments Canada has observed historical patterns that occur frequently enough around certain U.S. political events to be compelling indicators of market returns.
Two notable examples include the presidential and midterm elections in the United States. These often have global impact because the U.S. composes ~70 per cent of the MSCI World Index2 – a widely used interpretation of the developed global equity market – and has an outsized impact on global equity returns. So when a trend impacts the U.S. equity market, it usually has a similar effect in non-U.S. developed markets.
The Perverse Inverse
In a phenomenon Fisher Investments’ founder and co-chief investment officer, Ken Fisher, coined the “Perverse Inverse”, markets respond to U.S. presidential elections in a counter-intuitive way. Market participants typically see Republicans as more “market friendly” than Democrats, which some investors think should translate to strong returns after a Republican President gets elected. However, Exhibit 1 shows the opposite – inauguration years are typically stronger when a Democrat wins the presidency.
Exhibit 1: U.S. Presidential Elections and MSCI World Performance – A Perverse Inverse
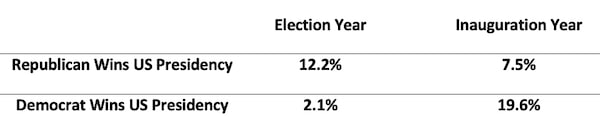
Source: FactSet, as of 11/10/2022; Average annual MSCI World Total Returns in election and inaugural years, 1970-2021. Presented in U.S. dollars.SUPPLIED
Fisher Investments Canada believes the Perverse Inverse is the result of investors overstating politics’ influence on markets. Markets tend to move on the disconnect between reality and expectations, and politicians seldom accomplish as much as people hope or fear. When it seems likely a Republican may win the presidency, markets cheer in an election year. But when investors are ultimately disappointed the administration can’t deliver on many of its pro-business campaign promises, markets are more subdued the following year. Conversely, markets often approach a Democrat presidency with more caution in an election year as investors worry (rightly or wrongly) about perceived anti-business campaign pledges, but ultimately rally the following year when their fears don’t come to fruition.
Another U.S. political phenomenon to watch revolves around midterm elections – held in November of a president’s 2nd year in office. Dubbed the “Midterm Miracle” by Ken Fisher, historically, markets tend to respond overwhelmingly favorably following midterm elections, irrespective of the political outcome. This is because the sitting U.S. president’s party typically loses relative power in midterms, entrenching political gridlock which equities enjoy, as we’ll explain in the next section. Political gridlock is an environment where politicians can accomplish very little, legislatively.
Since the beginning of reliable market data in 1925, the three calendar quarters commencing with midterm years’ fourth quarters are the most positive of any three sequential quarters in history. S&P 500 returns in that nine-month span average 19.6 per cent and are up 91.7 per cent of the time since 1925.3 Globally, we see similar trends. The MSCI World returns average 18.5 per cent over the same nine-month span and are up 87.1 per cent of the time since 1970.4
Why is political gridlock good for markets?
Fisher Investments Canada understands voters may not appreciate gridlock, but equities do because it reduces legislative uncertainty. In an environment with political gridlock, it is difficult to pass sweeping legislation, or legislation becomes watered down from its original scope and scale by the time it finally passes – limiting its potential impact on business and markets. Further, all of the arguing and negotiating amongst politicians in a gridlock environment saps the legislation’s surprise power since markets will have had time to fully digest any potential impacts of the legislation by the time it becomes law.
Gridlock allows companies to confidently build and execute investment plans, without fear that major change could be afoot. With political risk minimized, businesses and investors can focus their attention elsewhere.
Separate your investment strategy from your politics
Equities are largely apolitical over the long-term. Fisher Investments Canada thinks investors should reconsider letting political bias drive their investment decisions. Making emotional portfolio decisions based on an election or proposed policy could negatively affect you far longer than a new politician’s term. Instead, consider equities’ long-term average returns and take a cold, non-partisan view of the political landscape to assess the probabilities that new, sweeping legislation might disrupt equity markets.
Investing in financial markets involves the risk of loss and there is no guarantee that all or any capital invested will be repaid. Past performance is no guarantee of future returns. The value of investments and the income from them will fluctuate with world financial markets and international currency exchange rates. This document constitutes the general views of Fisher Investments Canada and should not be regarded as personalized investment or tax advice or as a representation of its performance or that of its clients. No assurances are made that Fisher Investments Canada will continue to hold these views, which may change at any time based on new information, analysis or reconsideration. In addition, no assurances are made regarding the accuracy of any forecast made herein. Not all past forecasts have been, nor future forecasts will be, as accurate as any contained herein.
Fisher Investments Management, LLC does business under this name in Ontario and Newfoundland & Labrador. In all other provinces, Fisher Asset Management, LLC does business as Fisher Investments Canada and as Fisher Investments.
1Source: FactSet, as of 03/02/2021; MSCI United Kingdom total return index, monthly from 31/12/1969 – 31/12/2020. Presented in pounds.
2Source: FactSet, as of 09/30/2022. The US composes 69.74% of the MSCI World Index. The MSCI World Index measures the performance of selected stocks in 23 developed countries. Values may not sum to 100% due to rounding.
3Source: Global Financial Data, Inc., as of 09/28/2022. Average S&P 500 total return and frequency of gains from September 30 of midterm years through June 30 of the following, 1926-2021.
4Source: FactSet, as of 11/10/2022; MSCI World Total Returns, monthly from 12/31/1969 - 9/30/2022. Annual MSCI World Total Returns in Year 3 Return, 1970-2021. Presented in US dollars.
This content was produced by Fisher Investments Canada. The Globe and Mail was not involved in its creation.