
The Halifax skyline looms behind pedestrians on the waterfront in Dartmouth, N.S., in 2018. The latest census showed more growth in downtown Halifax than any other city centre.Darren Calabrese/The Globe and Mail
Statistics Canada rolled out the first batch of data from the 2021 census on Wednesday, offering a picture of an urbanizing country whose growth was too robust for the COVID-19 pandemic to squelch.
The data show Canada’s population grew by 5.2 per cent from 2016 through 2021, bringing the total to 36,991,981 people. Most of that increase came in the first four of those years. The final year, during the pandemic, had the lowest growth since the First World War. The agency said it did not model how much more the population might have grown had the pandemic not emerged.
The census data also show a turnaround in the long trend of population loss in the Maritimes, and an increased rate of population growth in city centres.
“For most of the downtowns of the 41 large urban centres of the country, population growth actually accelerated in the last five years, compared to the previous five-year period,” said Laurent Martel, director of the Centre for Demography at Statistics Canada.
The agency acknowledged it was difficult to conduct a census during a pandemic and praised Canadians who participated in spite of the third wave of COVID-19. It said the response rate was 98 per cent.
This is only one of seven tranches of census 2021 data Statscan is expected to release. The agency will publish data on the country’s shifting demographic profile in April. Additional data on income, housing, mobility and other themes will come throughout the year.

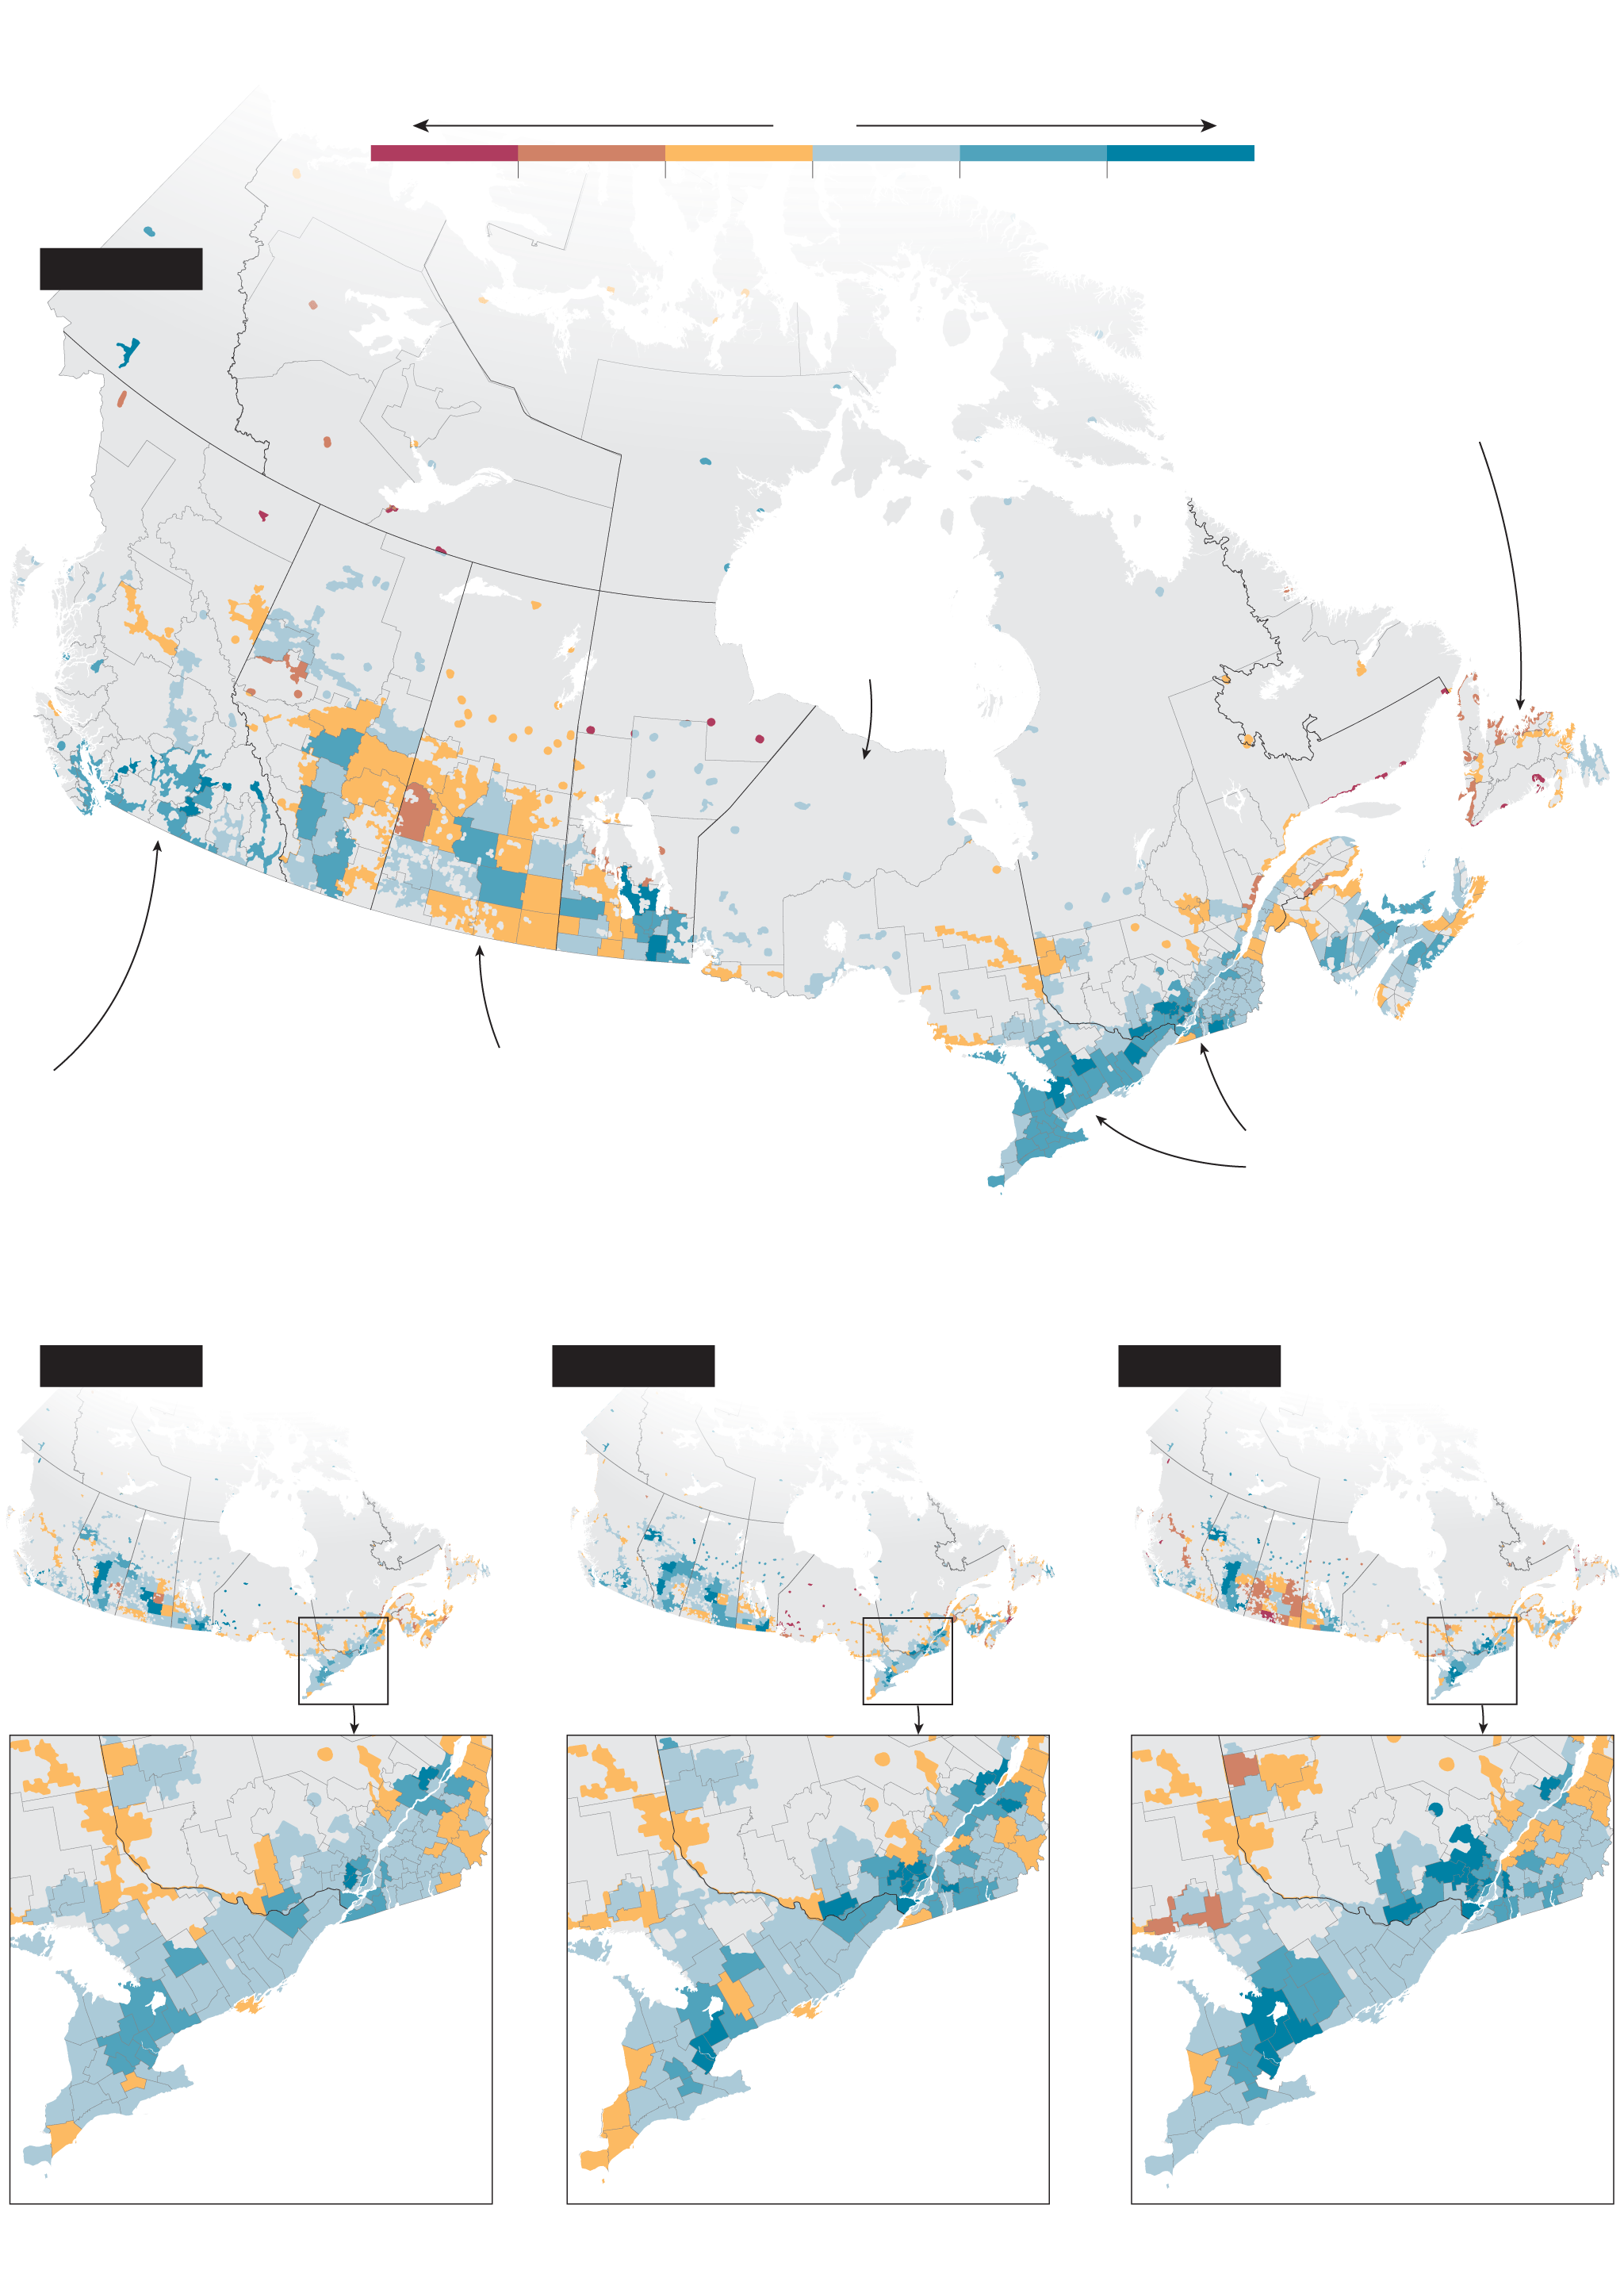
PERCENTAGE CHANGE IN POPULATION WHEN COMPARED TO PREVIOUS CENSUS, BY CENSUS DIVISION
Decrease
Increase
-10
-5
0
5
10%
Grey areas are sparsely populated
2016 to 2021
2011 to 2016
2006 to 2011
2001 to 2006
MURAT YÜKSELIR / THE GLOBE AND MAIL, SOURCE: STATISTICS CANADA

PERCENTAGE CHANGE IN POPULATION WHEN COMPARED TO PREVIOUS CENSUS, BY CENSUS DIVISION
Decrease
Increase
-10
-5
0
5
10%
Grey areas are sparsely populated
2016 to 2021
2011 to 2016
2006 to 2011
2001 to 2006
MURAT YÜKSELIR / THE GLOBE AND MAIL, SOURCE: STATISTICS CANADA

PERCENTAGE CHANGE IN POPULATION WHEN COMPARED TO PREVIOUS CENSUS, BY CENSUS DIVISION
Decrease
Increase
-10
-5
0
5
10%
Grey areas are sparsely populated
2016 to 2021
Yukon
NWT
Nunavut
B.C.
Alta.
Sask.
Man.
N.L.
Que.
Ont.
PEI
N.B.
N.S.
2011 to 2016
2006 to 2011
2001 to 2006
MURAT YÜKSELIR / THE GLOBE AND MAIL, SOURCE: STATISTICS CANADA

PERCENTAGE CHANGE IN POPULATION WHEN COMPARED TO PREVIOUS CENSUS, BY CENSUS DIVISION
Decrease
Increase
-10
-5
0
5
10%
2016 to 2021
ATLANTIC CANADA
There’s been moderate growth in the Atlantic provinces, except for Newfoundland, whose population decreased by 1.8 per cent since the last census
Yukon
NWT
Nunavut
B.C.
Grey areas
are sparsely
populated
Alta.
Sask.
N.L.
Man.
Que.
Ont.
PEI
N.B.
N.S.
B.C.
There’s been lots of growth in B.C. Large urban centres that saw the biggest growth rates were Kelowna (14%), Chilliwack (12.1%) and Kamloops (10%)
THE PRAIRIES
There’s been a decrease in population across rural parts of the Prairies. Large urban centres that saw the biggest growth rates for each province were Saskatoon (7.6%), Edmonton (7.3%), and Winnipeg (6.6%)
ONTARIO AND QUEBEC
The provinces saw a growth of 5.8 and 4.1 per cent. Large urban centres that saw the biggest growth rates were London, Ont., and Sherbrooke, Que., at 10 and 7.2 per cent respectively
2011 to 2016
2006 to 2011
2001 to 2006
MURAT YÜKSELIR / THE GLOBE AND MAIL, SOURCE: STATISTICS CANADA
Growth in the Maritimes
For years, the story of the Maritime provinces has been one of people leaving, but the latest census data show, from 2016 through 2021, more people moved to or were born in the three provinces than died there or left, for the first time since the early 1980s. And reversing an eight-decade pattern, population growth in the Maritimes outstripped that in the Prairie provinces.
The growth was largely due to immigration, according to Statscan, but also resulted from Canadians moving east. Although the agency says it is too early to know for sure whether any of this was due to the pandemic, an official there said COVID-19 could have played a role.
“In the 2020 to 2021 period … Halifax did track more migrants from Ontario [than from other provinces], possibly due to Canadians being able to work from home and lower housing costs,” said Larry MacNabb, a director-general in the social, health and labour statistics field at Statistics Canada.

PERCENTAGE CHANGE IN POPULATION WHEN COMPARED TO PREVIOUS CENSUS, BY REGION
Canada
30%
20
10
5.2%
0
-10
1971
1981
1991
2001
2011
2021
British Columbia
30%
20
7.6%
10
0
-10
1971
1981
1991
2001
2011
2021
Alberta
30%
20
10
4.8%
0
-10
1971
1981
1991
2001
2011
2021
Saskatchewan
30%
20
10
0
3.1%
-10
1971
1981
1991
2001
2011
2021
Manitoba
30%
20
10
5%
0
-10
1971
1981
1991
2001
2011
2021
Ontario
30%
20
5.8%
10
0
-10
1971
1981
1991
2001
2011
2021
Quebec
30%
20
10
4.1%
0
-10
1971
1981
1991
2001
2011
2021
New Brunswick
30%
20
10
3.8%
0
-10
1971
1981
1991
2001
2011
2021
Nova Scotia
30%
20
10
5%
0
-10
1971
1981
1991
2001
2011
2021
Prince Edward Island
30%
20
8%
10
0
-10
1971
1981
1991
2001
2011
2021
Newfoundland and Labrador
30%
20
10
-1.8
0
-10
1971
1981
1991
2001
2011
2021
Yukon
30%
20
12.1%
10
0
-10
1971
1981
1991
2001
2011
2021
Northwest Territories
30%
20
10
-1.7%
0
-10
1971
1981
1991
2001
2011
2021
Nunavut
30%
20
10
0
2.5%
-10
1971
1981
1991
2001
2011
2021
Note: For Nunavut, the population growth rate is provided only for the last four periods.
MURAT YÜKSELIR / THE GLOBE AND MAIL, SOURCE: STATISTICS CANADA

PERCENTAGE CHANGE IN POPULATION WHEN COMPARED TO PREVIOUS CENSUS, BY REGION
Canada
British Columbia
Alberta
30%
30%
20
20
7.6%
10
10
5.2%
4.8%
0
0
-10
-10
1971
1981
1991
2001
2011
2021
1971
1981
1991
2001
2011
2021
1971
1981
1991
2001
2011
2021
Saskatchewan
Manitoba
Ontario
30%
20
5.8%
10
5%
0
3.1%
-10
1971
1981
1991
2001
2011
2021
1971
1981
1991
2001
2011
2021
1971
1981
1991
2001
2011
2021
Quebec
New Brunswick
Nova Scotia
30%
20
10
5%
4.1%
3.8%
0
-10
1971
1981
1991
2001
2011
2021
1971
1981
1991
2001
2011
2021
1971
1981
1991
2001
2011
2021
Prince Edward Island
Newfoundland and Labrador
Yukon
30%
20
12.1%
8%
10
-1.8
0
-10
1971
1981
1991
2001
2011
2021
1971
1981
1991
2001
2011
2021
1971
1981
1991
2001
2011
2021
Nunavut
Northwest Territories
30%
20
10
Note: For Nunavut, the population growth rate is provided only for the last four periods.
MURAT YÜKSELIR / THE GLOBE AND MAIL, SOURCE: STATISTICS CANADA
-1.7%
0
2.5%
-10
1971
1981
1991
2001
2011
2021
1971
1981
1991
2001
2011
2021

PERCENTAGE CHANGE IN POPULATION WHEN COMPARED TO PREVIOUS CENSUS, BY REGION
Canada
British Columbia
Alberta
30%
30%
20
20
7.6%
10
10
5.2%
4.8%
0
0
-10
-10
1971
1981
1991
2001
2011
2021
1971
1981
1991
2001
2011
2021
1971
1981
1991
2001
2011
2021
Manitoba
Ontario
Saskatchewan
30%
20
5.8%
10
5%
0
3.1%
-10
1971
1981
1991
2001
2011
2021
1971
1981
1991
2001
2011
2021
1971
1981
1991
2001
2011
2021
Quebec
New Brunswick
Nova Scotia
30%
20
10
5%
4.1%
3.8%
0
-10
1971
1981
1991
2001
2011
2021
1971
1981
1991
2001
2011
2021
1971
1981
1991
2001
2011
2021
Prince Edward Island
Yukon
Newfoundland and Labrador
30%
20
12.1%
8%
10
-1.8
0
-10
1971
1981
1991
2001
2011
2021
1971
1981
1991
2001
2011
2021
1971
1981
1991
2001
2011
2021
Nunavut
Northwest Territories
30%
20
10
-1.7%
0
Note: For Nunavut, the population growth rate is provided only for the last four periods.
MURAT YÜKSELIR / THE GLOBE AND MAIL, SOURCE: STATISTICS CANADA
2.5%
-10
1971
1981
1991
2001
2011
2021
1971
1981
1991
2001
2011
2021
At the time, Ontario was being hit by waves of pandemic restrictions and, in many of its cities, surging real estate prices.
Over the five-year census period, all three Maritime provinces saw growth. Prince Edward Island registered an 8-per-cent increase, the highest among all 10 Canadian provinces. Nova Scotia grew by 5 per cent and New Brunswick by 3.8 per cent. The entire region added about 85,000 people, to reach a population of 1,899,324.
Newfoundland and Labrador, which is not included in the Maritimes, was the outlier. Its population fell by 1.8 per cent, representing about 9,000 people.
The increased Maritime population is a welcome addition to the region’s labour force, Atlantic Provinces Economic Council senior researcher Patrick Brannon said. But, he added, there’s a psychological benefit as well.
“For 30 years, we’ve been seeing out-migration, and that wears on you. You hear about all your young people leaving,” he said.
“It’s really younger people that are coming back. That’s really positive, you know, and the immigration is creating a more diverse population. … So, you know, we’ve got some momentum in the region right now.”
New metropolises
Kelowna, in British Columbia’s Okanagan Valley, was the fastest-growing census metropolitan area in the country over the past five years. Its population increased by 14 per cent as it added more than 27,000 people.
Statscan says there are six more census metropolitan areas (CMAs) – the official term for a place with a population greater than 100,000 – in 2021 than there were five years earlier. Joining the list are the New Brunswick capital of Fredericton, Quebec’s Drummondville, the Alberta city of Red Deer and the B.C. cities of Kamloops, Chilliwack and Nanaimo.
Three of the new CMAs were also among the fastest-growing ones in the country. Kelowna, Chilliwack, Kamloops and Nanaimo all grew by at least 10 per cent, collectively adding about 60,000 people.
James Moore, Kelowna’s long-range policy planning manager, said a recent city growth plan assuming 45,000 additional people over the next 20 years may soon need to be revised.
“I think, over all, we’re well placed to accommodate that kind of growth,” he said. “The question for me is whether we need to project for more growth than that, and whether the pace we’ve seen over the past five years, which is much more rapid than normal, is something that’s sustained over the long term.”
There are now 41 CMAs across Canada. Collectively, they are home to nearly three-quarters of the country’s population. According to Statscan, these areas accounted for most of the country’s population increase from 2016 through 2021.
However, the growth was uneven. Calgary, which during this census period suffered the impact of a struggling oil patch, dropped out of the top five fastest-growing CMAs for the first time in a quarter-century. Its growth rate ranked 24th, immediately behind Winnipeg, but the city still managed to add about 90,000 people.
“Another sign of the acceleration of population growth among large urban centres: Actually none showed a population decrease in the last five years, and this is a first in six censuses,” said Laurent Martel, the Statistics Canada Centre for Demography director.
A more urban country
City downtowns added people in large numbers over the past five years, census 2021 data show, in spite of anemic population growth and in a few cases declines during the first part of the pandemic.
These downtowns grew faster in most cities than outlying regions – faster even than the farthest suburbs, which typically offer the cheapest real estate and the most living space in their metropolitan areas.
Taken as a whole, the population of the downtown areas of large urban centres grew 10.9 per cent from 2016 through 2021. That was more than twice the pace recorded over the previous census cycle. It also comfortably exceeded the latest census cycle’s overall city population growth rate of 6.1 per cent.
“We’re a country that’s becoming more and more urban,” Statscan’s Mr. MacNabb said. “The share of folks living in urban versus rural areas continues to grow.”
The trend toward city-centre living slowed when the pandemic hit. Some city downtowns experienced population declines from 2020 through 2021, including Montreal (down 3.1 per cent) and Vancouver (down 2.9 per cent), while Toronto eked out a gain of only 0.4 per cent.
However, the huge downtown growth in the first four years of the census period suggests city centres could boom again as immigration levels return to normal.
Significant growth from 2016 through 2020 left many city cores considerably more populous over the whole census cycle, even taking COVID-19 into account. Toronto’s downtown population was up 16.1 per cent over the five years, Montreal’s was up 24.2 per cent and Halifax led the country with 26.1-per-cent growth in its downtown.
At the same time, cities have continued to sprawl. The suburbs farthest from city cores grew at 8.8 per cent over the census period. The population of what Statscan calls the “urban fringe,” which is defined as everything within a 10-minute drive of a city core, grew by only 3.7 per cent, while the suburbs between the fringe and the most outlying areas grew by 5.8 per cent.
Canada leads the G7
Canada’s rate of population growth led the Group of Seven countries over the past five years, even though pandemic-related border controls slashed the number of immigrants – which the country relies on to keep growing – during part of that period.
In the broader Group of 20, Canada’s population growth rate ranked seventh, on par with India and behind countries such as Australia and South Africa.
However, Canada’s five-year growth figure of 5.2 per cent obscures a radical shift caused by the pandemic. While there was a record-high rate of growth from 2016 to 2019, population growth in 2020 was at a record low.
“We have to go back to [the] First World War – that’s about 100 years back in time – to find a population growth rate that was as low as the one we registered for 2020,” Statscan’s Mr. Martel said.
Still, even at that low level, the country led the other G7 countries over the year. According to Statscan, the United States managed only 0.1 per cent growth in 2020.
The precipitous drop from 2019, which saw a record population increase of about 583,000, underscored how reliant Canada is on immigration.
New arrivals accounted for four-fifths of the country’s population growth from 2016 through 2021. The rest was due to natural increase, meaning the amount by which births exceeded deaths. The rate of natural increase has been sliding for years. During this census cycle, it dropped to 0.1 per cent from 0.3 per cent.
That natural increase is the lowest on record, according to Statscan. However, the agency does not expect the rate to turn negative, as it has already in countries such as Italy and Japan, in the next 50 years. The decrease was attributed in the census materials to an aging population and declining fertility, which the agency says has also hit a record low, at 1.4 children for each woman in 2020.
Population and the pandemic: More from The Globe
The Decibel
Early in the COVID-19 pandemic, many speculated that lockdowns would lead couples to have more babies – but statistics showed the opposite happened. The Globe and Mail's Zosia Bielski explains why. Subscribe for more episodes.
Population trends
Toronto, Montreal populations decline as urban exodus accelerates
Nova Scotia nears a population milestone as the province experiences record levels of immigration
Canada’s next wave of immigration set to add more fuel to overheated housing market
 Oliver Moore